Real Estate Information Archive

Blog

Displaying blog entries 1-4 of 4

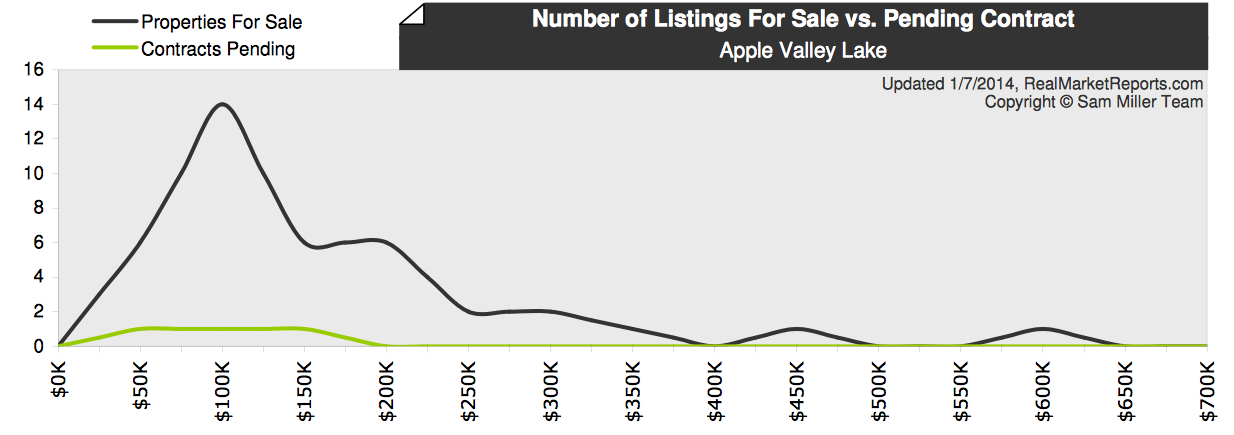
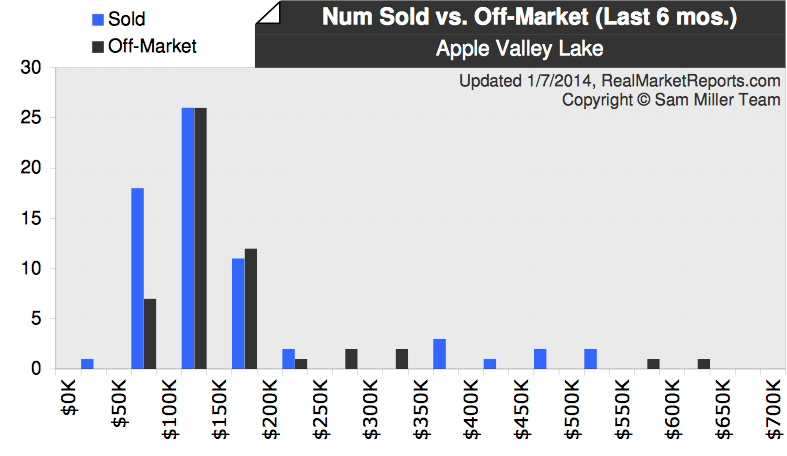
Apple Valley Lake home sales have been on the rise and we have been experiencing a boost in home sales.  This report highlights the Apple Valley Lake home sales activity over the last 6 months comparing the number of Apple Valley Lake homes that sold with the available homes for sale along with pending home sales and off markets.  This report offers a much more detailed view of the Apple Valley Lake real estate market than the typical reports that only show the number of homes SOLD.  


Apple Valley Lake Home Sales Report by Sam Miller


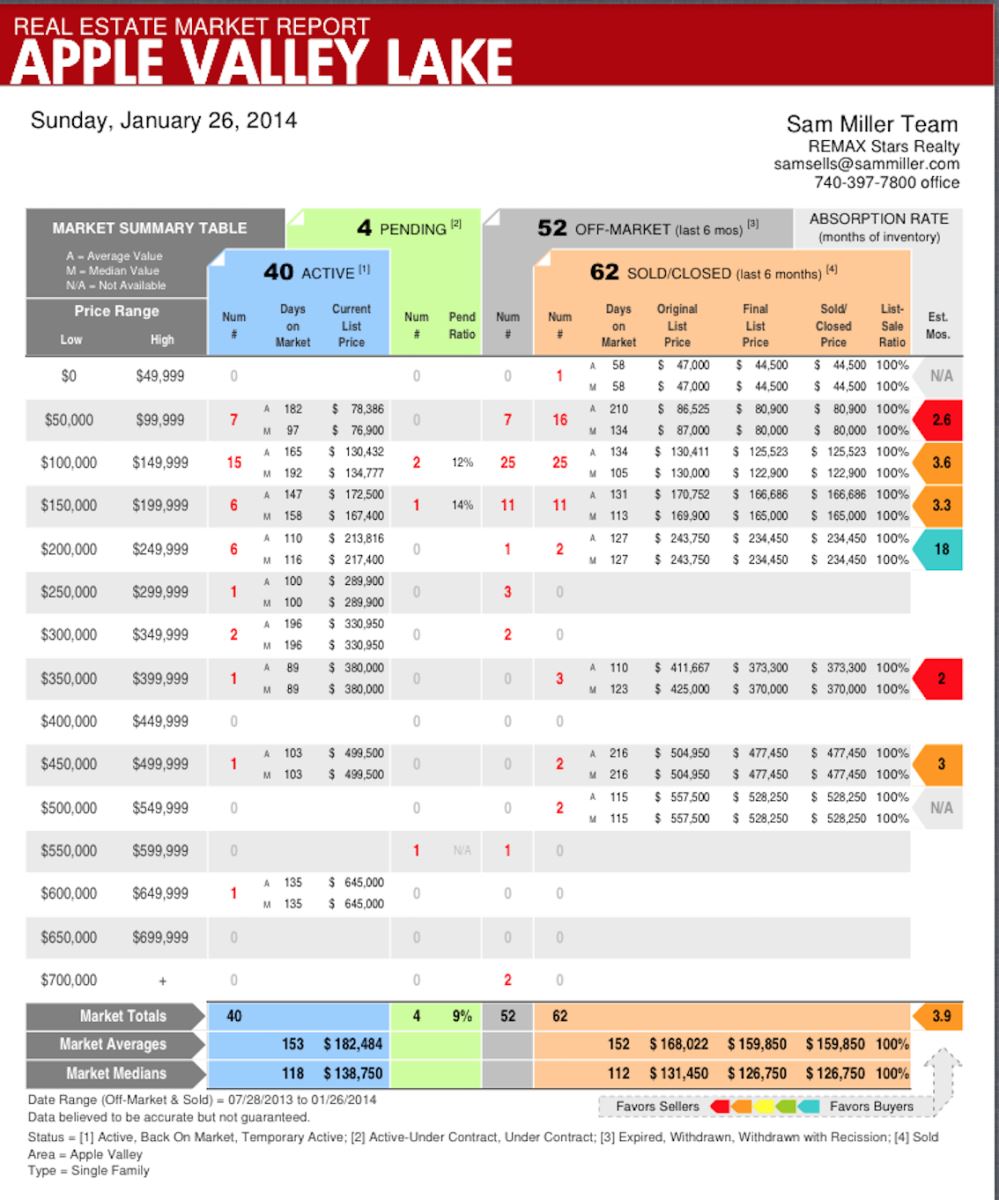
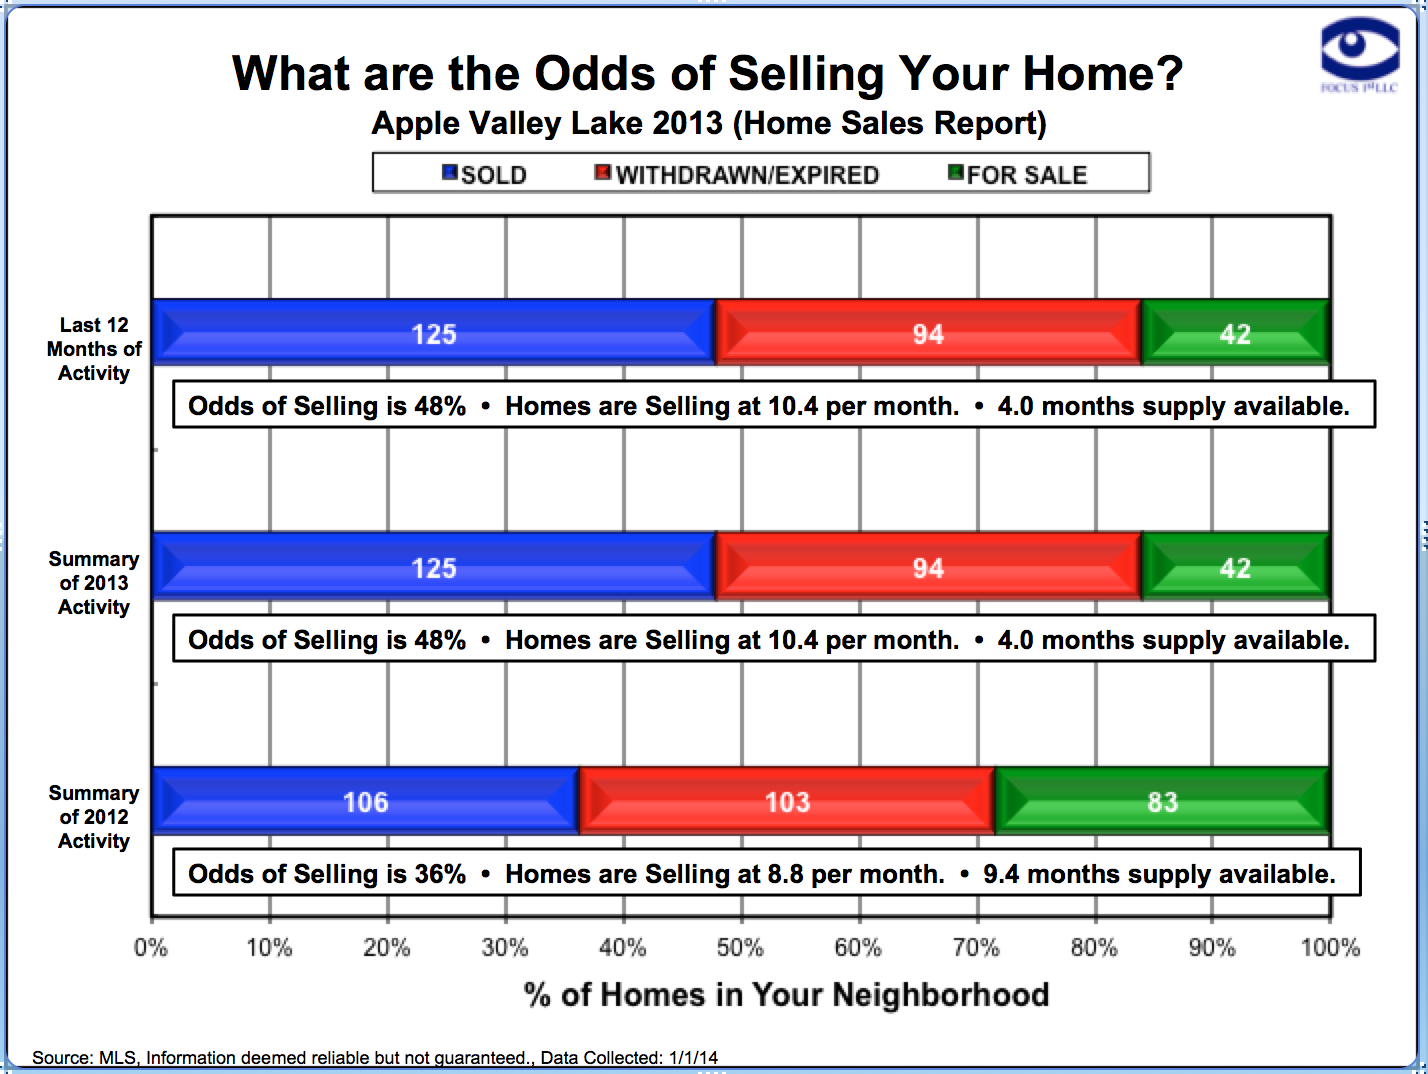
The very top section of this report breaks down each segment of the Apple Valley Lake housing market and it features the absorption rate for each specific price range.  This is very important because it paints the most accurate picture of the housing market and demand.  Take an extra close look at the far right side of this report and you will see that the column is broken down by color coding and each color identifies if that price range currently favors buyers or sellers based on the available months of inventory.  Red favors the sellers because there is a shortage of listings based on recent home sales and blue favors buyers because there is currently more available homes than buyers buying in that price range.  The housing trends and absorption rates that are featured in this report are constantly changing especially during the different seasons so be sure to watch for our weekly updated Apple Valley Lake housing reports.


View our Apple Valley Lake homes for sale and you can also view our Apple Valley Lake lots for sale 


Let's take a look at the Apple Valley Lake real estate market activity.  Currently there are 3 home with sales pending in the market overall, leaving 39 homes still for sale. The resulting pending ratio is 7.1% (3 divided by 42). So you might be asking yourself, that's great... but what exactly does it mean? I'm glad you asked!

Apple Valley Lake Real Estate Report Featuring Pending Home Sales

The pending ratio indicates the supply & demand of the market. Specifically, a high ratio means that listings are in demand and quickly going to contract. Alternatively, a low ratio means there are not enough qualified buyers for the existing supply.  These numbers change dramatically at the Apple Valley Lake depending on the time of year and weather conditions.  This time of year with snow on the ground and when the lake is frozen over there are simply fewer buyers looking than compared to the peak boating season during the summer.  

During the winter months the pending ratio typically ranges from 6% to 9% which is when the ratio is at it lowest for the year.  During the spring and summer we can see the "sale pending ratio" approach 25%.  The sunshine months bring people to the lake for a little fun in the sun boating, jet skiing and spending time at the beaches.  When people are on the lake it boosts buyer interest and also drives demand for Apple Valley Lake homes.

Taking a closer look at the graphic above, we notice that the $50,000 to $100,000 price range has a relatively higher number of contracts pending sale.  We also notice that the $100,000 to $150,000 price range has a relatively large inventory of properties for sale at 14 listings.  The median list price (or asking price) for all properties in this market is $142,500.

Apple Valley Lake Homes SOLD by Price Range Compared To Expired Listings Report by Apple Valley Lake REALTOR Sam Miller

A total of 66 home sales contracts successfully sold and closed at the Apple Valley Lake in the last 6 months with a median sold price of $123,500.  Breaking it down, we notice that the $100,000 to $150,000 price range contains the highest number of sold homes.  The graphic above shows the level of home sales at the Apple Valley Lake during the last 6 months (in blue) and it also shows the number of homes that were either withdrawn or expired from the market (in black).  The graph demonstrates that there are hot spots in the Apple Valley Lake housing market.   When the spring season is upon us the these market trends will begin to shift and the Apple Valley Lake housing market will begin to bloom once again.

Facebook users, If you would like to be plugged into regular Apple Valley Lake updates connect with us by clicking and "Liking" our Apple Valley Lake Facebook page.


The annual fireworks celebration is scheduled for Saturday, July 5th, 2014.  The day is typically filled with lots of activities and other events such as the ski show and other beach and lake activities.  If you have never experienced the fireworks from a boat before I highly recommend that you make plans this year to do it.  Bucket List Worthy!!!

The fireworks are typically launched near the Apple Valley Lake Clubhouse which is located near the mid point of the lake making it idea to view from the water without being directly under the fireworks.   If you enjoy taking photos this is one of the best times of the year to capture an amazing photo at the Apple Valley Lake because you can capture the fireworks and an amazing reflection in the lake.  Apple Valley Lake Fireworks Photo by Apple Valley Lake REALTOR Sam Miller

Hope to see you there!!!


Sam Miller


Apple Valley Lake 2013 Annual Home Sales Report

by Sam Miller

The 2013 Apple Valley Lake housing reports the strongest increase in annual home sales this community has experienced since 2007.   The detailed report below was created using statistical date from the Knox County Ohio MLS by Apple Valley Lake REALTOR Sam Miller of REMAX Stars Realty.    


Apple Valley Lake 2013 Home Sales Report


  • 17.9% increase in the number of homes sold in 2013
  • 12% increase in the odds of selling your Apple Valley home in 2013
  • Apple Valley Lake market averaged 10.2 homes sales per month
  • Nearly 10% fewer homes remained unsold compared to 2012
  • In 2012 there was a 9.4 month supply of available homes and only 4 month supply in 2013 which confirms that the Apple Valley Lake housing market is more balanced today.
  • Report data compares 2013 and 2012 Apple Valley home sales activity

​Market report by Sam Miller


Displaying blog entries 1-4 of 4

Syndication

Categories

Archives

Instagram